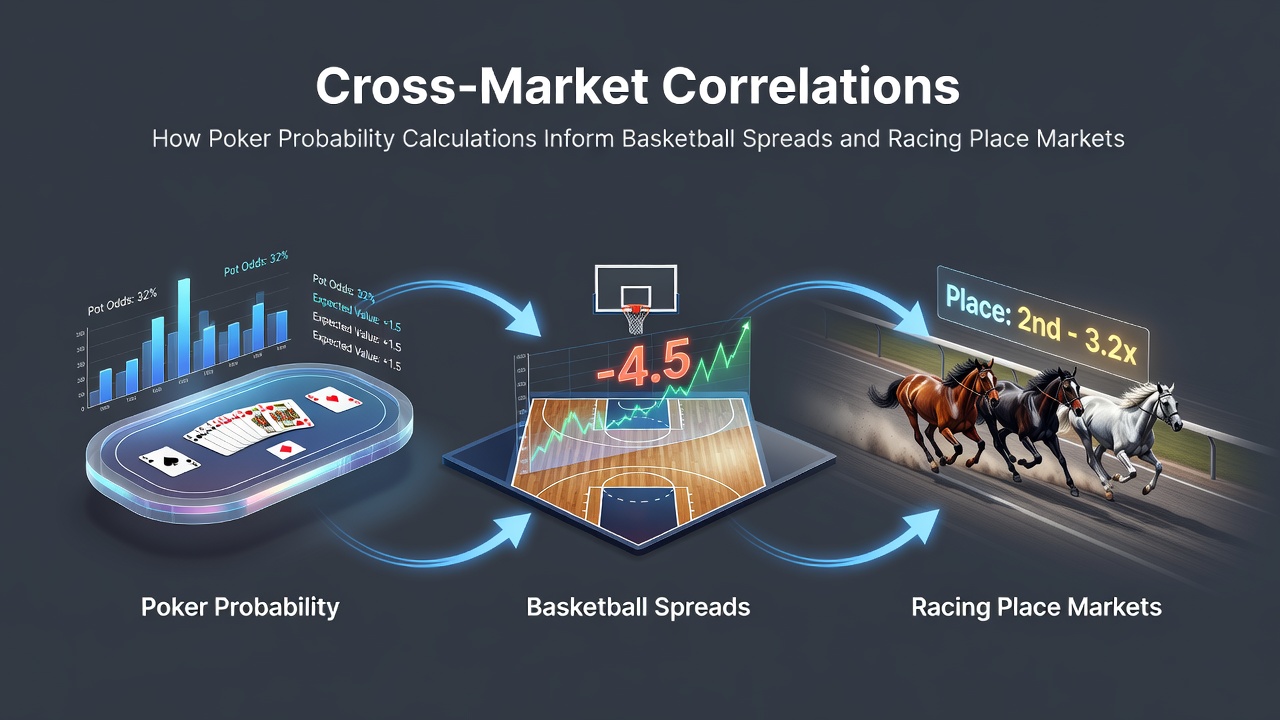
Cross-Market Correlations: How Poker Probability Calculations Inform Basketball Spreads and Racing Place Markets
Probability calculations developed at poker tables rely on combinatorial analysis and expected value formulas that extend beyond cards into other betting environments, where similar mathematical structures appear in basketball point spreads and racing place markets. These methods allow participants to assess ranges of outcomes rather than single events, creating frameworks that translate across disciplines even when surface rules differ substantially.
Poker Foundations in Range Construction and Expected Value
Texas Hold'em players calculate hand equities by enumerating possible opponent holdings and comparing them against community card possibilities, which produces percentages that guide decisions on whether to call, raise, or fold. The same enumeration principle appears when basketball analysts build models for point spreads, because they must account for distributions of team performances instead of assuming fixed margins. Researchers have observed that both domains treat uncertainty as a spectrum of weighted scenarios rather than binary results.
Racing place markets further illustrate the connection because bettors evaluate the likelihood that a horse finishes in the top three or four positions, which mirrors poker calculations that weigh multiple ways a hand can win rather than focusing solely on first-place finishes. Data from industry reports shows that successful models in each market incorporate variance estimates alongside raw probabilities, allowing adjustments when new information arrives during play.
Translating Poker Odds into Basketball Spread Mechanics
Basketball spreads incorporate team strength differentials, pace metrics, and injury impacts that create implied probabilities for covering a given number. Observers note that these implied probabilities can be refined using poker-style range construction, where analysts assign likelihoods to various scoring outputs rather than relying on average projections alone. The approach treats each team's possible point totals as overlapping distributions, much like poker ranges overlap during post-flop play.
One documented method involves converting spread lines into win probabilities and then layering additional variables such as rest advantages or travel effects, which parallels how poker players adjust equity calculations for stack sizes and position. According to figures from the Nevada Gaming Control Board, basketball betting volumes have increased alongside more granular statistical modeling, suggesting market participants increasingly apply multi-variable probability tools originally refined in card games.
Application to Racing Place Markets and Placement Probabilities
Place betting in horse racing requires estimating not only a runner's chance of winning but also its relative finishing position against the rest of the field. This multi-outcome requirement aligns closely with poker calculations that track multiple paths to victory or survival. Models that simulate thousands of race outcomes generate placement percentages that can be compared directly against bookmaker odds, revealing discrepancies similar to those poker players seek in pot odds situations.
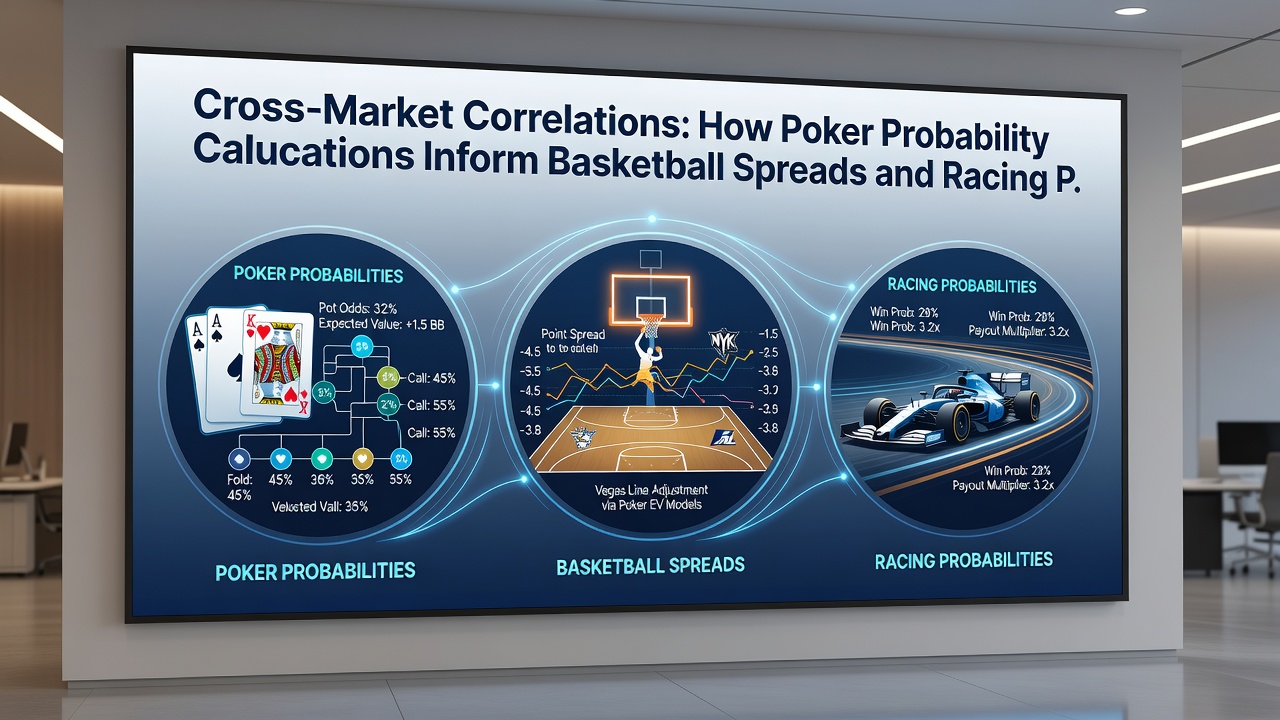
Trainers and analysts have incorporated pace figures and sectional timing data into these simulations, creating layered probability trees that echo the decision branches found in poker hand reading. Evidence from academic studies on sports modeling indicates that such tree-based approaches improve accuracy when fields contain many runners with correlated running styles, because the calculations explicitly account for interference effects between competitors.
Shared Modeling Techniques Across Markets
Monte Carlo simulations, originally popularized in poker software for equity computation, now appear routinely in basketball and racing analytics platforms. These simulations generate thousands of iterations that produce probability distributions for final margins or finishing orders. The resulting outputs allow direct comparison between markets, revealing periods when basketball spreads or racing place odds deviate from modeled expectations in ways that parallel poker spots where pot odds exceed equity.
Market correlations become visible when volatility spikes in one sector influence pricing in others, particularly during overlapping seasons when major basketball tournaments coincide with prominent racing festivals. Participants who maintain consistent probability frameworks across these environments can identify pricing inefficiencies that single-market analysis might miss.
Conclusion
Probability methods refined through poker continue to shape analytical practices in basketball spreads and racing place markets because the underlying mathematics of ranges, equities, and expected value remain consistent. Observers note that continued refinement of simulation techniques and data integration will likely strengthen these cross-market connections, especially as real-time information flows increase across betting platforms. The patterns demonstrate how foundational calculations travel between seemingly distinct wagering categories without requiring fundamental changes to their core logic.